

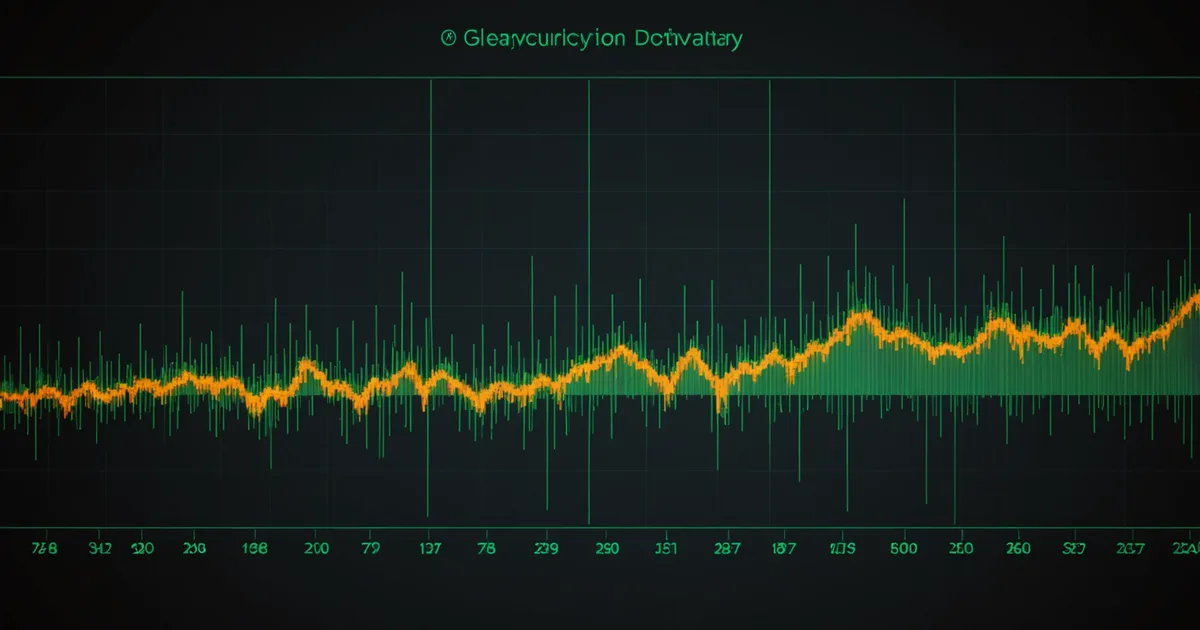
What SMART actually monitors
S.M.A.R.T. (Self-Monitoring, Analysis and Reporting Technology) was standardized for rotating hard drives in the mid-1990s and has been adapted for SSDs and NVMe drives ever since. The spec defines a set of numbered attributes. Each attribute has a normalized value between 1 and 253, a raw value in a format specific to the manufacturer, and a failure threshold set by the drive vendor. When a normalized value drops below the threshold, the drive reports a warning state.
The attributes most monitoring setups watch form a short list: attribute 5 (Reallocated Sector Count), attribute 197 (Current Pending Sector Count), attribute 198 (Uncorrectable Sector Count), and attribute 187 (Reported Uncorrectable Errors). For spinning platters with surface defects, these are genuine physical signals. A platter accumulating remapped sectors is telling you its read-write surface is degrading. That signal has real predictive value for HDDs with magnetic platters.
The problem is that the storage fleet in most data centers today is predominantly SSD and NVMe. Those failure modes work differently, and SMART was not redesigned to accommodate them. Manufacturers adapted SMART attributes to flash, but the mapping is approximate at best and misleading in specific cases.
How SMART thresholds work and why they fire late
SMART's alert mechanism is based on a normalized value crossing a manufacturer-set threshold. The threshold is set conservatively: when the normalized attribute 5 value drops below the failure threshold on most drive models, the drive is already in a state of significant degradation. You are not getting a two-week warning. You are getting a same-day warning, if you get any warning at all.
This is not a configuration problem that better tooling can fix. It is a design property of how SMART thresholds are defined. The threshold is a confirmed-distress indicator, not a leading indicator. Drive manufacturers designed SMART primarily to reduce warranty returns on drives that are obviously failing, not to give fleet operators weeks of operational lead time.
The other structural issue is that threshold-crossing is a binary event. Either the normalized value is above the threshold (healthy) or it is below (failing). There is no signal in the space between those states. A drive where normalized attribute 5 has been declining from 200 to 180 to 165 to 148 over four months reads as "healthy" at every polling interval right up until it crosses the threshold. The slope of that decline contains prediction-relevant information that the threshold check discards entirely.
The temporal gap: rate of change matters more than current value
Consider two drives, both currently showing a reallocated sector count of 15. Drive A has shown exactly 15 reallocated sectors since its second year of operation, unchanged over 18 months of continued use. Drive B had a count of 0 five weeks ago and has been gaining 2 to 3 per week since. Both drives report the same current SMART state. Any static threshold check treats them identically.
Drive B is in active degradation. Drive A has a stable minor irregularity with no progression signal. The operationally meaningful question is not "how many reallocated sectors does this drive have?" but "is the rate changing, and at what velocity?"
Standard SMART polling does not capture this by default. It captures a snapshot per polling interval. To extract a rate of change, you need a time-series store that retains per-attribute values across polling intervals and computes deltas. Most monitoring setups poll SMART, check the current value against a threshold, and discard the historical data. The temporal signal is generated and then immediately discarded. This is where the majority of prediction-relevant information is lost.
Temperature delta patterns illustrate this clearly. A drive's current temperature matters less than whether its temperature variance has increased significantly over the past two weeks. Increasing thermal instability at a constant workload is a component stress signal that appears in no standard SMART threshold check, but is present in the historical telemetry of many drives in the weeks before failure.
SSD failure mechanisms that SMART does not map to cleanly
Flash storage fails through mechanisms that have no direct analog in the rotating-platter model SMART was designed for. The two most common paths are NAND cell wear-out (program-erase cycle exhaustion causing cells to become unreliable) and controller-level faults (firmware bugs, power loss corruption, or internal arbitration failures). Neither produces a gradual reallocated sector accumulation of the kind SMART's primary failure attributes are designed to detect.
SSD manufacturers tried to map their failure indicators into the existing SMART attribute schema, but the mapping is imprecise. Attribute 5 on an SSD counts remapped NAND blocks rather than disk sectors. Whether that count represents wear-pattern failure or manufacturing defect recovery depends on context that is not in the SMART output. Attribute 177 (Wear Leveling Count) and attribute 233 (Media Wearout Indicator) were added by vendors to surface endurance data, but the calculation behind "percentage remaining" varies enough between Seagate, WD, Samsung, and SK Hynix implementations that a uniform threshold across drive models produces unreliable results.
NVMe drives compound this further. The NVMe specification defines a Health Information Log structurally different from SMART. The critical warning field, available spare percentage, and media data integrity errors are NVMe-specific fields, not SMART attributes. Tools that read NVMe health through an ATA-passthrough SMART emulation layer discard information and sometimes assign NVMe health data to SMART attribute slots with incorrect semantics. When you read NVMe drives through a SMART compatibility layer, you are reading a partial translation of the actual health data, not the health data itself.
The attributes that carry real predictive signal
When looking at the telemetry of drives that failed without ever crossing a SMART failure threshold, patterns appear in attributes that most monitoring configurations either do not poll or treat as low-priority:
Command timeout count (attribute 188) correlates with controller-level instability. Unlike reallocated sectors, command timeouts do not require physical surface damage. They can indicate firmware-level degradation or controller state corruption that precedes a hard failure by days or weeks while all standard SMART attributes remain in normal range. Most monitoring dashboards do not surface this attribute.
Write error rate raw values, specifically the high-byte counters on drives from certain manufacturers, contain a velocity component that the normalized value deliberately smooths out. Normalizing the value keeps healthy drives above threshold, which is the design intent. But the raw write error rate acceleration is a predictor, and it is in the data if you read it directly rather than relying on the normalized representation.
Available spare percentage on SSDs, particularly when combined with weekly write volume, gives a wear-trajectory signal more predictive than wear leveling count alone. A drive writing 50GB per day and burning through available spare at twice the expected rate for its model is worth close attention, even if its absolute spare percentage looks comfortable at the current snapshot.
Vendor-specific telemetry you are likely not reading
Every major drive manufacturer includes vendor-specific attributes in the attribute numbers above 190. These are outside the ATA spec and require vendor documentation to interpret. They are also where the most granular failure precursor data lives in the telemetry stream.
Seagate drives expose a recovery attempt count that distinguishes between corrected reads (normal operation) and reads that required multiple retry cycles to succeed. A rising retry rate is a stronger precursor signal than the standard read error rate attribute for many Seagate model families. Western Digital drives expose detailed error category breakdowns that separate firmware-triggered retries from media-triggered retries. Samsung SSDs expose a total write workload counter that factors in write pattern type, not just byte volume, which is a better wear predictor for random-write-heavy workloads than attribute 177 alone.
Without reading and interpreting these attributes per drive model, you are working with roughly half the health signal the drive is emitting. Most standard SMART monitoring tools either ignore vendor-specific attributes entirely or surface them as unlabeled raw numbers with no interpretation guidance. The signal is being generated. It is not being used.
Where this leaves fleet monitoring
We are not arguing that SMART is useless. The standardized attributes capture real hardware state, and a drive crossing a SMART failure threshold is genuinely at elevated risk. The point is the gap between what SMART exposes by default and what is needed for advance failure prediction with 7 to 30 day lead times.
That gap has three components: SMART checks current attribute values without capturing rate-of-change trajectories; the standard attribute set was designed for HDDs and maps imprecisely onto SSD and NVMe failure mechanisms; and vendor-specific attributes, which contain the most granular signal for those drive families, are excluded from most monitoring configurations.
Closing that gap does not require replacing SMART. It requires building on top of it: retaining historical attribute values to compute deltas and acceleration, adding vendor-specific attribute collection per drive model family, and applying model-specific normalization so that what counts as an anomalous trajectory for a given drive model is calibrated against the actual failure patterns of that model rather than a generic threshold applied uniformly across every drive in the fleet.
The supplementary signal is not exotic. It is already being emitted by the drives in your fleet. Reallocated sector velocity, media error acceleration, command timeout frequency, and vendor-specific endurance counters are present in the telemetry stream. The gap is in how monitoring tools collect and interpret that data, not in what the drives report.